Card Fraud and Disputes Performance Review
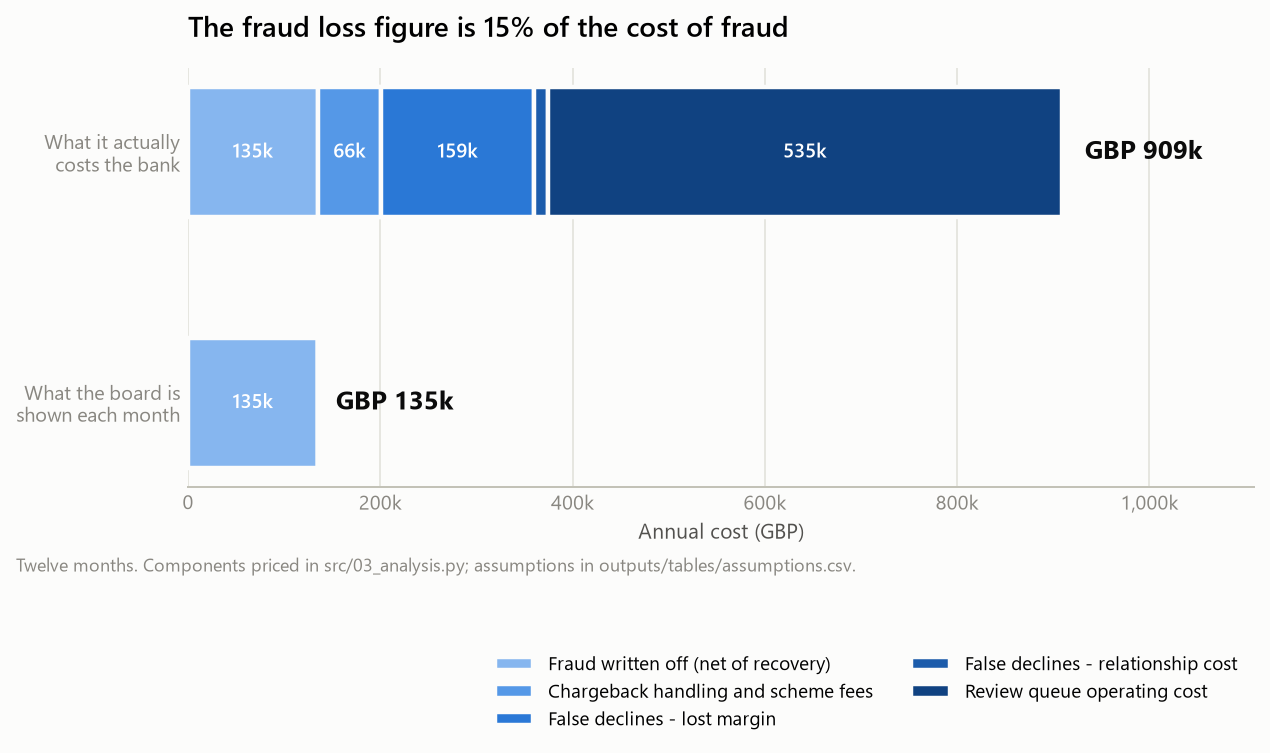
A fraud engine was reported as costing £135k. Counting false declines and investigator time, it cost £909k. This project shows the full cost and recommends a change that saves £118k.
About the data. The data is synthetic, generated with the same table structure as public card-fraud datasets and calibrated to published UK figures (net fraud loss 6.9 bps of card spend against a UK Finance benchmark of about 6.9 bps; 73.6% prevention against roughly 72%). The pound figures belong to a 14,000-customer generator, not a real bank, so quote the rates, not the totals. What transfers to real data is the method.
The problem
Fraud teams are judged on fraud losses, which are easy to report and easy to push down. That number hides two other costs: genuine customers the engine blocks, and investigator time spent on alerts that are almost never fraud. Nobody had put them side by side, so nobody knew whether the engine was tuned sensibly.
What I built
Rule-by-rule evaluation
SQL over 2.4 million transactions in DuckDB scored each detection rule for precision and unique catches, with confidence intervals on small counts.
A two-sided cost model
Fraud losses, chargeback handling, margin lost on false declines and the review queue, all in one number, with every assumption listed.
A recommendation that survives the boardroom
The cheapest rule set would nearly triple fraud loss, which no fraud director would sign. I re-optimised under a cap: fraud loss may rise by no more than 20%.
How it works
- GenerateSynthetic transactions built from fraud typologies, not from the rule thresholds, so the rules are not tested against themselves
- ModelDuckDB warehouse applies eight rules and joins disputes and outcomes
- AnalyseRule performance, matched difference-in-differences, cost model, threshold sweeps
- ReportFive-page dashboard, executive summary and reconciliation to control counts
What I found
- The reported number was 15% of the real one. The largest cost line is £535k of investigator time on alerts that are genuine in more than 99 cases in 100.
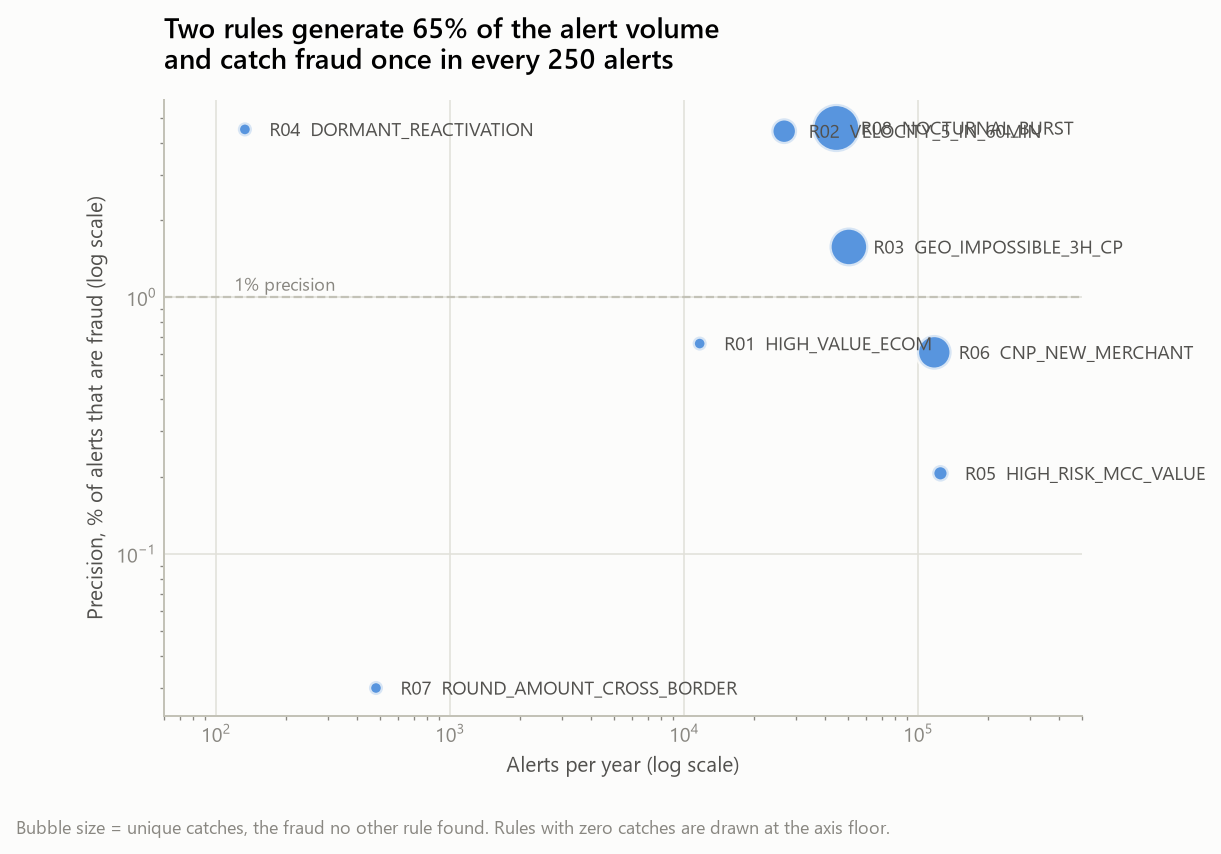
- Two rules produce 64% of alert volume and catch fraud about once in 250 alerts. One rule has zero unique catches, so it is pure cost.
- Measuring the behavioural cost of a false decline: two of three designs gave the wrong answer. The matched difference-in-differences gave -8.1% (95% CI -13.4 to -2.7).
- The recommended change saves £118k, releases 1.2 FTE of investigator time and removes 12,964 false declines a year.
Limits and honest notes
- Rules were rebuilt from published typologies, not read from a production engine.
- Only above-the-line testing: lowering a threshold needs a re-scan of transactions that never alerted.
- The behavioural effect is measured over 60 days, so the false-decline cost is an underestimate.
- Every control count ties (2,412,960 transactions in and out) and rates reconcile to UK Finance benchmarks. Absolute pound totals do not, and are labelled that way.