Prescribing Variation and Medicines Optimisation
A league table of GP practices mostly ranks patient age. Age-sex standardisation and funnel plots find the practices that are genuinely different, across 6,300 practices and 8.8 million rows.
About the data. The figures come from a synthetic dataset in the NHS Business Services Authority (NHSBSA) prescribing data schema. BNF codes, drug names, generic and branded pairs, NHS England's low-priority list and the age-sex bands are real; the practices and their volumes are generated. The project includes a working extractor for the real NHSBSA Open Data Portal, and the analysis runs unchanged on real extracts. Known gap: low-priority items are 13.2% of spend here against 1 to 2% nationally, so that figure shows the method and is not a business case.
The problem
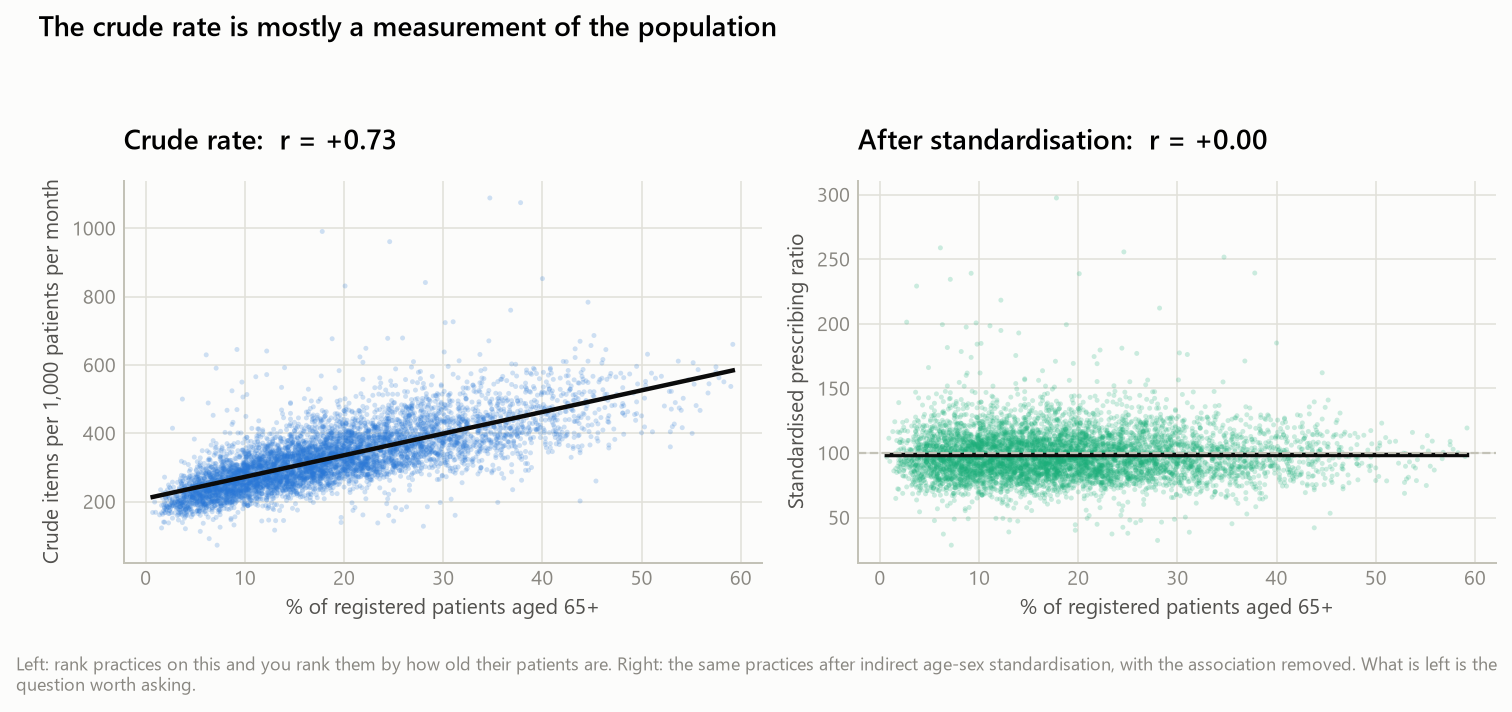
Medicines optimisation teams either ignore variation or write to the practices at the top of a league table. The top of a crude league table is mostly practices with older patients, so about half the letters go to practices prescribing appropriately. That damages the working relationship and the next letter is ignored.
What I built
Standardised rates
Indirect age-sex standardisation, with prescribing unit weights built from first principles. A 75-year-old counts as about 3.6 average patients for statins and about 1.2 for antibiotics.
Funnel plots
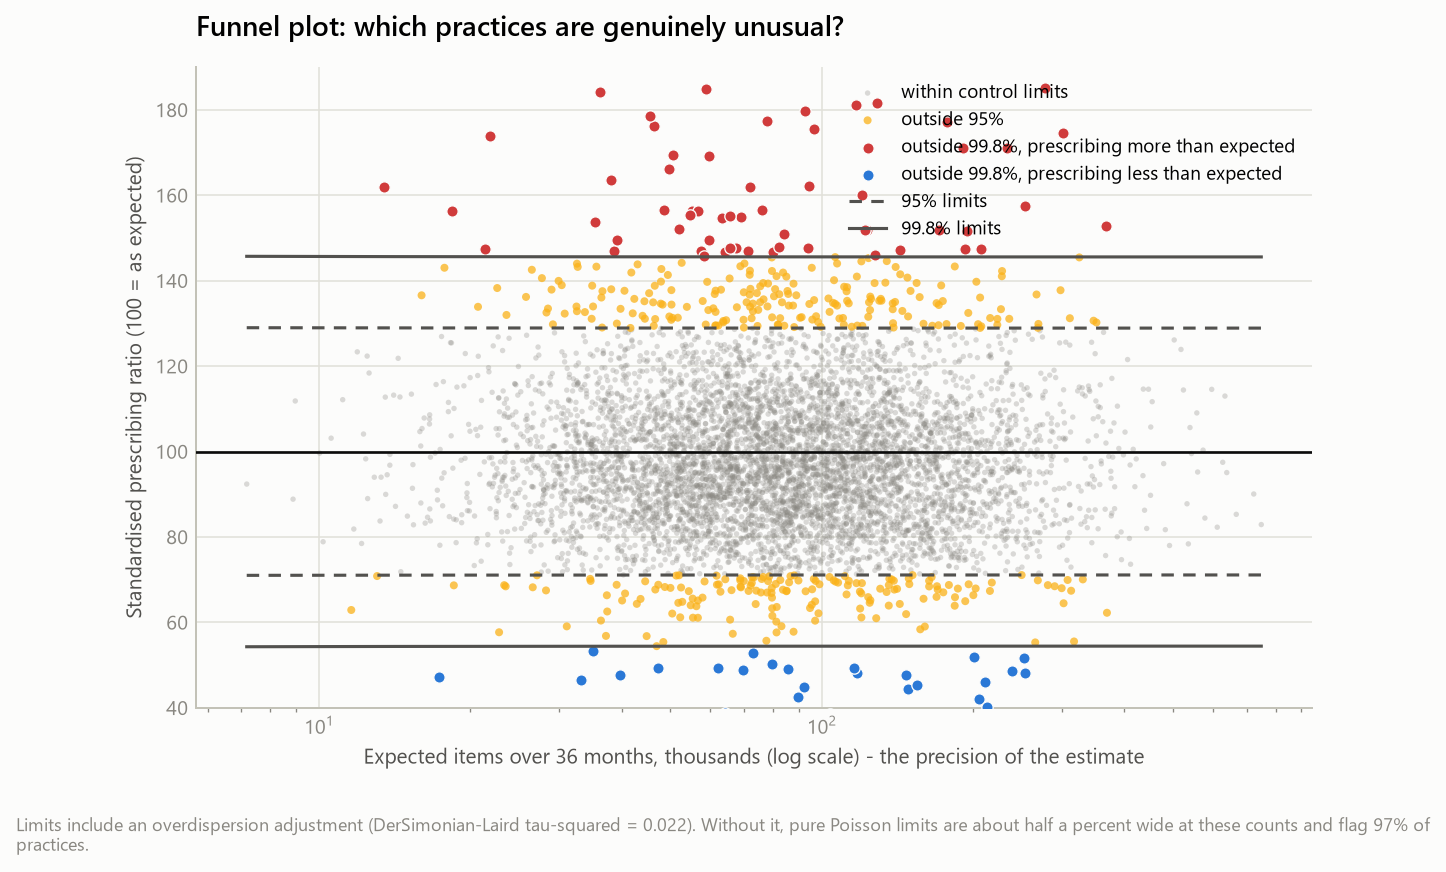
Limits adjusted for overdispersion, validated against known ground truth: 95 practices were given a real effect and neither method was told which.
An extractor and a practice report
A working API extractor with server-side filtering, and a practice-level report written for a clinical audience.
How it works
- ExtractNHSBSA Open Data Portal with server-side filtering, cutting about 17 million rows a month to about 150,000
- ModelDuckDB over 8.8 million prescribing rows
- StandardiseExpected prescribing from age-sex mix, funnel limits with overdispersion
- ReportFive-page dashboard, executive summary and reconciliation to source totals
What I found
- The league table ranks population age: crude rate correlates +0.73 with the share of patients over 65. After standardisation the correlation is +0.00.
- A funnel plot at 99.8% limits flagged 111 practices at 65% precision and 76% recall. A league table of similar workload reached 47% and 47%.
- On this data small practices are only 22% of the ranking extremes, so the usual textbook argument for funnel plots is barely true. I report that rather than repeat the rule.
- 16% of practices account for half of all low-priority spend, which makes it a conversation with a defined list.
Limits and honest notes
- Only age and sex are adjusted for. Deprivation, disease prevalence and local service set-up could still explain a practice's position, so the practice report has a section headed what we are not saying.
- Savings assume 80% achievable generic switching and 70% achievable low-priority reduction, never 100%.
- Source and model item counts tie exactly: 636,233,742 items and £955,172,641 cost.
- Practice mergers, closures and code changes are not modelled.