UK Property Deal Analyser
Which UK areas actually stack up for a buy-to-let investor? Public data answers it: 2.9 million Land Registry sales, joined to ONS rents, scored with a transparent model and shown in a Power BI dashboard.
The problem
Property deal sourcing runs on gut feel and hearsay. The data to do better is free: every sale in England and Wales is published by HM Land Registry and the ONS publishes average rents by local authority. This is that analysis, built end to end from raw public data and reproducible from two commands.
What I built
A reviewable SQL pipeline
2.9 million raw rows loaded into DuckDB, cleaned and aggregated in plain .sql files (2.4 million clean sales out).
A transparent deal score
Weighted z-scores: yield 40%, growth 25%, affordability 20%, liquidity 15%, with the weights tested for ranking stability.
A Power BI deal finder
A star schema, DAX measures and a page spec, so the dashboard can be rebuilt exactly.
How it works
- SQL pipelineLoad, clean and aggregate in DuckDB
- Rent joinONS average rents by district and property type, matched by name normalisation
- Deal scoreWeighted z-scores across yield, growth, affordability and liquidity
- OutputsCharts, a ranked deal table and a star schema of CSVs for Power BI
What I found
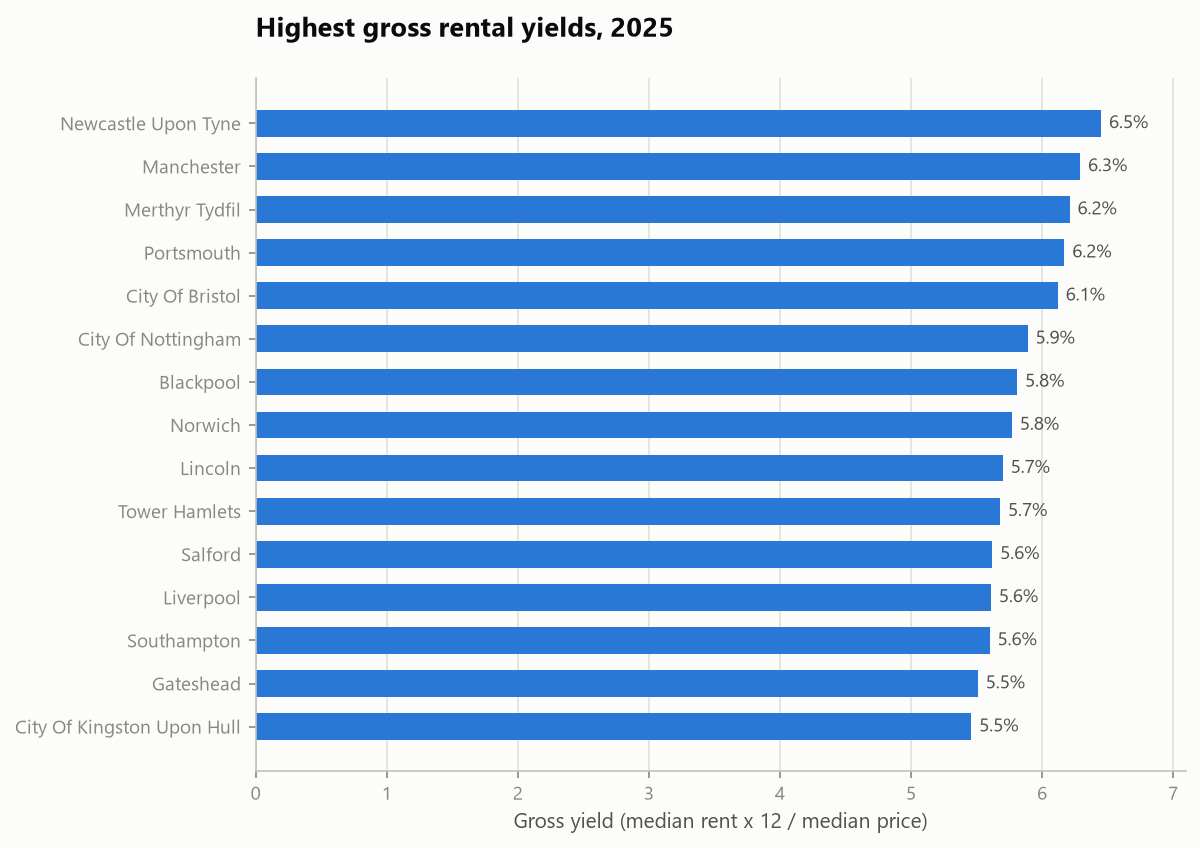
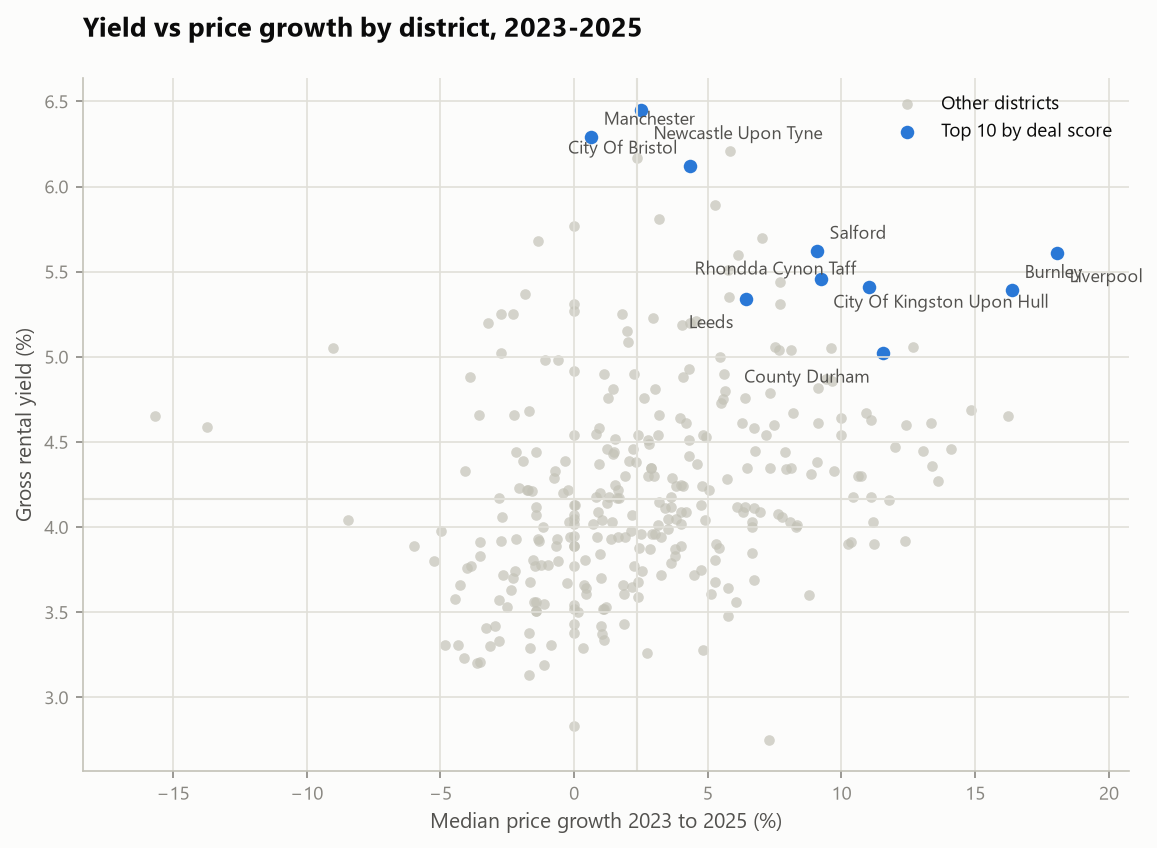
- The North beats the South on every investor metric. Liverpool tops the deal score with 18.1% price growth since 2023, a £183k median price and a 5.6% gross yield.
- Small northern flats are the yield play: Sunderland flats return 9.9% gross and Middlesbrough flats 8.8%, against 4.0% in Kensington and Chelsea.
- Prime London is repricing: Westminster median prices fell 13.7% and Hammersmith and Fulham 15.7% over the window.
- New builds carry a median 28% premium over established stock in the same district.
Limits and honest notes
- The score uses gross yield, not net, and rents are advertised-stock averages.
- The ranking is a shortlist generator, not financial advice.
- Districts with under 300 sales a year are excluded because thin markets make the median and the exit unreliable.